Re: [問題] 折線圖+長條圖呈現
作者: cd12631 (<(◥█◤△◥█◤)>) 2016-11-23 01:33:12
想看別種繪圖嗎?
plotly: 我這不是來了嗎?
借用celestialgod的data frame作範例
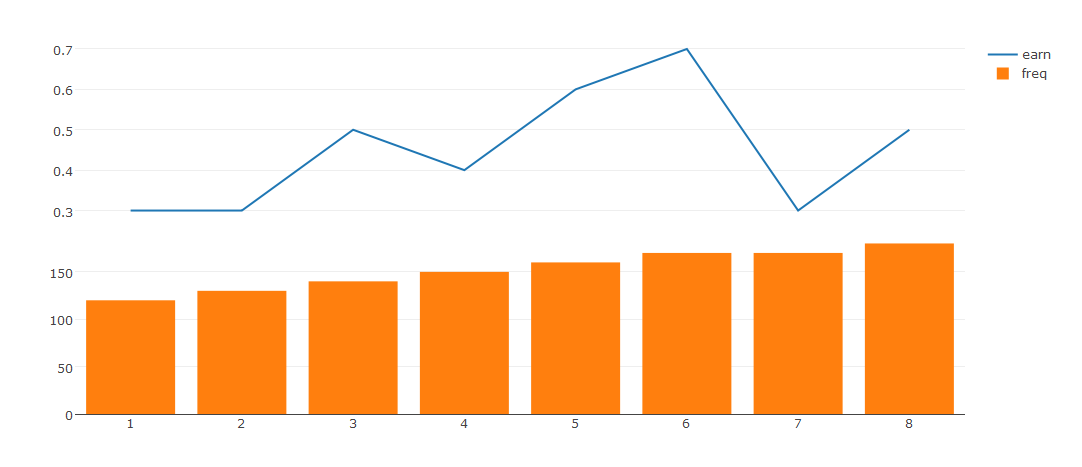
library(plotly)
dt <- data.frame(
x = 1:8,
freq = c(120,130,140,150,160,170,170,180),
earn = c(3,3,5,4,6,7,3,5) * 0.1
)
dt_earn_plotly <- plot_ly(data = dt, x=dt$x, y=dt$earn, type = "scatter",
mode = "liners", name = "earn")
dt_freq_plotly <- plot_ly(data = dt, x=dt$x, y=dt$freq, type = "bar", name =
"freq")
dt_plotly <- subplot(dt_earn_plotly, dt_freq_plotly, nrows = 2, shareX =
TRUE)
dt_plotly
圖:
![]()
互動介面: http://yichunsung.github.io/plotly
Code可能在Github上你會看得比較清楚:
https://github.com/yichunsung/R_Application/blob/master/plotly%20sample.R
plotly: 我這不是來了嗎?
借用celestialgod的data frame作範例
library(plotly)
dt <- data.frame(
x = 1:8,
freq = c(120,130,140,150,160,170,170,180),
earn = c(3,3,5,4,6,7,3,5) * 0.1
)
dt_earn_plotly <- plot_ly(data = dt, x=dt$x, y=dt$earn, type = "scatter",
mode = "liners", name = "earn")
dt_freq_plotly <- plot_ly(data = dt, x=dt$x, y=dt$freq, type = "bar", name =
"freq")
dt_plotly <- subplot(dt_earn_plotly, dt_freq_plotly, nrows = 2, shareX =
TRUE)
dt_plotly
圖:
互動介面: http://yichunsung.github.io/plotly
Code可能在Github上你會看得比較清楚:
https://github.com/yichunsung/R_Application/blob/master/plotly%20sample.R
作者: celestialgod (天) 2016-11-23 01:39:00
哈哈哈,推,真的有人刻了偷偷說偷懶的方法其實是直接把ggplot的圖,加上ggplotly就好
作者: samex4x4 (Same) 2016-11-23 09:54:00
出現第四個套件啦XDD 真的好多畫法啊
作者: clansoda (小笨) 2016-11-23 11:09:00
plotly比較fancy,而且用ggplot的語法就能實現端看個人喜好XDD,漂亮的大家都愛阿
作者: andrew43 (討厭有好心推文後刪文者) 2016-11-23 19:14:00
現在是在集七龍珠嗎?
作者: locka (locka) 2016-11-23 23:02:00
可以藉機請教cd12631大大怎麼把圖放到github.io上的嗎?謝謝cd大!! 我試成功了,感謝!
繼續閱讀
[問題] 如何在自己的伺服器上建立R-leaflet套件lovealbee[問題] shiny io 中文顯示問題samex4x4[問題] glmmPQL無法收斂問題ppp1987[問題] 無法用shiny server執行leaflet套件rlearner[問題] (救回) loop in analysiscelestialgod[問題] (救回) loop 中 cell 內細格等於變項celestialgod[問題] (救回) 如何讀入多個CSV檔celestialgod[問題] (救回) find & substr 在r的應用celestialgodRe: 呼籲:有板友推文回應後請儘量不要刪除原文celestialgod[問題] (救回) 多回圈loop 與paste celestialgod